Update 2015-06-03: Initial State has added this project to their blog.
Last year marked the end of my full time project of 7 years. After that project ended, it was expected that I would have some bench time coming.
Unrelated, but mentioned during one of our work hipchat sessions, Jason Worley mentioned the idea of an empty coffee pot detector that was echoed by others (and myself) as a cool idea. When my bench time arrived, I started looking into the idea.
From the Stack Exchange link above, I read one of the alternate answers using a nerdkit to alter a basic scale to interface with a computer. While this is a cool and inexpensive way of hooking a scale up to a computer, I found an easier way.
While talking with our DevOPs guys, Chris Chalfant and Andrew Kaczorek, Chris mentioned he'd heard of a similar project using a USB Scale. After some quick searching, I found a post detailing steps the poster took to connect a stamps.com scale to a raspberry pi. That post references some C code that was used to pull the Scale readings from the stamps.com model. I noticed in the scales.h file in the repo that there are a handful of other scales that would be supported by this particular library.
So, I set to comparing them to decide which scale would best suite my needs. I decided on the DYMO M10 Digital Postal Scale because a full pot of our coffee weighs just shy of 2 kg (5 pounds), I wanted to leave our scale with a little head room in case we got a larger pot and needed to weigh more coffee. Next I had to modify the code to support this particular scale. If you notice in the repo, I've included the "usbscale.py" file. This was the original python script I found that would read binary data from a USB device. The getWeightInGrams method of the coffee_scale.py script is my modification to this script that allows the app to collect the data.
 1 def getWeightInGrams(dev="/dev/usb/hiddev0"):
 2     grams = -1
 3     try:
 4         fd = os.open(dev, os.O_RDONLY)
 5
 6         # Read 4 unsigned integers from USB device
 7         hiddev_event_fmt = "IIII"
 8         usb_binary_read = struct.unpack(hiddev_event_fmt, os.read(fd, struct.calcsize(hiddev_event_fmt)))
 9         grams = usb_binary_read[3]
10         os.close(fd)
11     except OSError as e:
12         print("{0} - Failed to read from USB device".format(datetime.utcnow()))
13     return grams
On Line 9 above, you'll notice that I am only considering the fourth byte read from the USB device. I imagine which byte, and which segments you need will depend on the scale, and the driver you're using to read the data. In my case, it appeared that no matter the calibration (either grams or pounds) on the front of the scale, this byte was always returning the number of grams placed on the scale. This is a very simplistic implementation to read the weight on the scale, but I didn't need my implementation to do much, just detect when the coffee pot was empty.
The Raspberry Pi is nothing more than a basic installation of Raspbian. The instructions on raspberrypi.com are very helpful for getting setup with the pi. After adding a USB wifi dongle for the raspbery pi, and an automated script to restart the wifi in the event that it falls over, I integrated the pi to stream data directly to initialstate.com. Note: I used initialstate's Python library for integration, and had to reference their github repository README rather than their documentation. I initially copy/pasted the code from their documentation, and since my code runs infinitely in a loop, I was never flushing the buffer to send the data to them. My code needed simply to have the .close() method called on the streamer object:
 1 def logToInitialState():
 2     utcnow = datetime.utcnow()
 3     bucketKey = "{0} - coffee_scale_data".format(_environment)
 4
 5     streamer = Streamer(bucket_name="{0} - Coffee Scale Data".format(_environment),
 6             bucket_key=bucketKey, access_key=_initialStateKey)
 7
 8     if potIsLifted():
 9         streamer.log("Coffee Pot Lifted", True)
10     streamer.log("Coffee Weight", _currentWeight)
11     streamer.close()
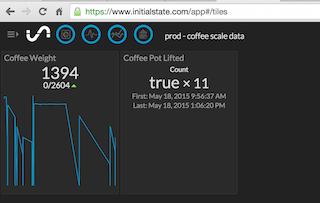
The above code, combined with a morning's worth of people lifting the coffee pot to pour their mug and refill the pot, give me two tiles that look like this:
All of the python code that I wrote is available on github.
TODOS:
- I’d like for the “Lifted” tile to appear as just a number, rather than “true X 11”
- It’d be great if there were a way to provide a public dashboard view of this visualization
- Additional metrics for: # of Full Pots, # of mugs poured, etc.
